2021 marked the 25th year in a row in which the key Greenland ice sheet lost more mass during the melting season, than it gained during the winter, according to a new UN-endorsed report issued on Friday.
The data from the Danish Arctic monitoring service Polar Portal – which forms part of the UN weather agency WMO’s annual State of the Climate report – shows that early summer was cold and wet, with unusually heavy and late snowfall in June, which delayed the onset of the melting season.
After that, however, a heatwave at the end of July, led to a considerable loss of ice.
In terms of “total mass balance” (the sum of surface melting and loss of ice chunks from icebergs, in addition to the melting of glacier “tongues” in contact with seawater), the ice sheet lost around 166 billion tonnes during the 12-month period ending in August 2021.
.")
Polar Portal
The difference between the annual suface mass balance for the periods 2010-2021 and 1981-2010 (expressed as mm ice melt).
Climate change
These numbers mean the ice sheet ended the season with a net surface mass balance of approximately 396 billion tonnes, making it the 28th lowest level recorded, in the 41-year time series.
This could be considered an average year, but Polar Report notes how perspectives have changed, due to rapidly advancing climate change.
At the end of the 1990s, for example, these same figures would have been regarded as a year with a very low surface mass balance.
The report also notes that the cause of the early summer chill, could be due to conditions over southwest Canada and the northwest United States.
In these territories, an enormous “blocking” high pressure system was formed, shaped like the Greek capital letter Omega (Ω).
 and the extreme heat over North America.")
Polar Portal
The map shows cool, moist summer weather over Greenland (in the middle of the map) and the extreme heat over North America.
This flow pattern occurs regularly in the troposphere, and not just over North America, but it had never been observed with such strength before.
According to the report, an analysis by World Weather Attribution demonstrated that it could only be explained as a result of atmospheric warming caused by human activity.
Notable year
According to the report, 2021 was notable for several reasons.
It was the year in which precipitation at Summit Station, which is located at the top of the ice sheet at an altitude of 3,200 metres above sea level, was registered in the form of rain.
The year also saw an acceleration of the loss of ice at the Sermeq Kujalleq glacier, where the rate of loss had otherwise been stagnant for several years.
Winter snowfall was also close to average for the period between 1981 and 2010, which was good news, because a combination of low winter snowfall and a warm summer can result in very large losses of ice, as was the case in 2019.

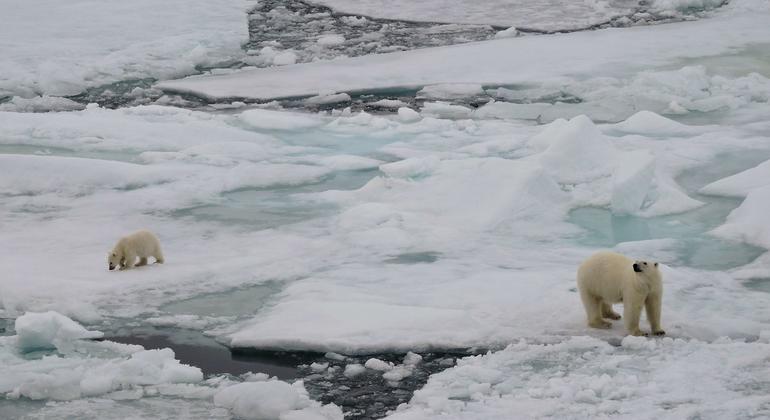
© WMO/Karolin Eichier
In Greenland, the melting of ice sheets is accelerating.